Build a K-Nearest Neighbors Graph From Scratch
- Published on
- ∘ 13 min read ∘ ––– views
Tags
Previous Article
Next Article
What / Why?
"K-Nearest Neighbors" is a popular algorithm used to find trends in sets of data where they otherwise might not be obvious. Given n-dimensional data that we can classify into various categories, we can use KNN to predict what class an unknown n-dimensional data-point falls into based on its proximity to the nearest K points.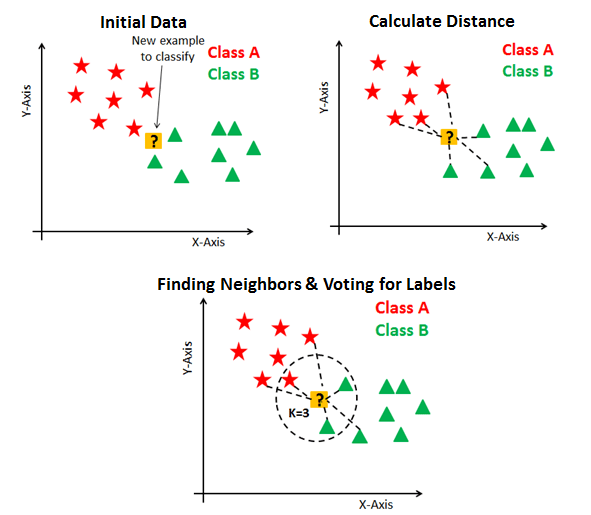
These trends can be fairly obvious for two and even three dimensional data as clear regional divides stand out, but what about n > 3 dimensional data, where it becomes much harder to visually comprehend? All of the sudden, KNN just became harder to conceptualize as these regions can no longer be divided by simple linear or quadratic curves...
This article aims to flesh out a simple, albeit inefficient, KNN algorithm as well as a real-time two dimensional graph that depicts what the algorithm is doing beneath the hood. The end result is inspired by this awesome Observable article by Nikhil Thorat.

Setup
The setup for this project is pretty straightforward – we'll be using the p5.js library to streamline the visual aspects of the project and vanilla JavaScript for the rest of the project.
To begin, we'll need a bare bones index.html file to reference our the p5 library and our JavaScript file:
<script src="https://cdnjs.cloudflare.com/ajax/libs/p5.js/0.8.0/p5.js"></script>
<script src="https://cdnjs.cloudflare.com/ajax/libs/p5.js/0.8.0/addons/p5.dom.js"></script>
<script src="sketch.js"></script>
After that, just create a new file called sketch.js and we can jump in!
Code!
p5.js has several native functions that we'll be using in this project, but the main two that we'll be working within are setup() and draw() so let's declare those and instantiate some global variables, and knockout some simple config stuff:
const  scale = 10; // This will be used to control the scale of our graph
const size = 40; // Let's go for a 40x40 graph

function setup() {
  // This will give us a 400 x 400 px window
  createCanvas(scale * size, scale * size);
  frameRate(30); // Play around with this improve performance/smoothness
}

// Draw gets called once every "frame"
function draw() {
  // Remove everything from the canvas
  clear();
}
Now that we've established the skeleton of our file, let's set up a grid. I'm going to sequester this, and most of the drawing tasks, to its own method to keep the parental draw() function clean:
function showGrid() {
  stroke(0, 0, 0, 100); //r, g, b, a values
  strokeWeight(1);
  for(var i = -width/2; i < width/2; i+=scale) {
    line(-width/2, i, width/2, i); // horizontal lines
    line(i, -height/2, i, height/2); //vertical lines
  }

  // Draw the axes
  stroke(0);
  strokeWeight(2);
  line(-width/2, 0, width/2, 0);
  line(0, -height/2, 0, height/2);
}
Sweet, a grid! Hopefully the use of the scale variable is starting to make sense. We don't need a full 400 x 400 grid, but a 40 x 40 grid is going to be way to small. If we upscale and increment everything by scale, we should get a 'magnified' grid.
To test this out, let's create some global "test data":
const scale = 10;
const size = 40;
const dataset = { "red":[ [8, -8],
                        [8, -10],
                        [4, -10]],
              "green":[ [-6, 6],
                        [-4, 6],
                        [-6, 2]],
              "blue": [ [5, 5],
                        [5, 10],
                        [5, 15]]
              }
function setup(){...}
Our dataset variable is an object with classifications and then an array of arrays of x, y coordinates. Now let's implement another helper method to plot the points on the graph:
/*
 * @param p an array [int x, int y]
 */
function showPoint(p) {
  strokeWeight(scale); // Give our points some screen presence
  let x = p[0] * scale;
  let y = p[1] * scale;
  point(x, y); // Use p5's built in point!
}

/*
 * @param points an array of [x, y] arrays
 */
function showPoints(point) {
  for(let f in points) {
    stroke(f);
    for(let p of points[f]) {
      showPoint(p);
    }
  }
}
showPoint() will display a single point and showPoints() will display a list of points, coloring them according to their classification. Our classifications are trivially restricted to "red", "green", and "blue", but real data might have much more consequential implications.
To use these methods, plop them into draw() along with a translate() invocation so that our grid system's origin is in the center of our canvas, rather than the native top left corner:
function draw() {
  clear();
  translate(width/2, height/2);
  showGrid();
  showPoints(dataset);
}
Dots and a grid, now we're getting somewhere. Before we dive into the meat of the KNN algorithm let's add our prediction point:
//With our global scale, size, and dataset variables:
let np = [0, 0];


//Then inside draw,
function draw() {
  clear();
  translate(width/2, height/2);
  showGrid();
  showPoints(dataset);
  np = [(mouseX - width/2)/scale, (mouseY- height/2)/scale];
  showPoint(np);
}
Using the native p5 variables width, height, mouseX, and mouseY we can draw a point that tracks our cursor. This will be our 'prediction point' which we'll classify using the KNN algorithm. Speaking of which, let's get started on that!
function knn(data, predict, k) {
  let distances = []; // keep track of all the distances from our current point 'predict' to every other point

  // Iterate over every point in our dataset and calculate the distance
  for(let p in data) {
    for(let f of data[p]) {
      let x1 = f[0];
      let x2 = predict[0];
      let y1 = f[1];
      let y2 = predict[1];
      let e_dist = dist(x1, y1, x2, y2); //p5.js dist() only works for 2D vectors, which is fine for our simple graph, but inadequate for n-dimensional data; n > 2
      distances.push([e_dist, p, f]) //push the distance, the point itself, and it's classification to the distance list
    }
  }
}
This snippet just calculates the Euclidean distance from the current point to every other point. Now we want to find the k-nearest points and predict what class of point our current point is based on their classifications. In order to to find the k-nearest neighbors, we'll need to sort our distances list by the 0th element: the distance itself. To do that we'll need to define a comparator, so let's step out of our knn() method and quickly define one:
function Comparator(a, b) {
  if (a[0] < b[0]) return -1;
  if (a[0] > b[0]) return 1;
  return 0;
}
Back inside knn(), right beneath that nested for loop let's find the k-nearest neighbors:
let sorted = distances.sort(Comparator);
sorted.splice(k) // we don't need to keep track of every point, just the k-nearest
let votes = []; // sum the "votes" from each neighbor
for(let i = 0; i < sorted.length; i++) {
  votes[i] = sorted[i][1]; //This will be the class "red", "green", or "blue"
}
Again let's take a step back. We need to figure out the most highly "voted" class which will be the most common element in votes. Define/steal a helper method from StackOverflow to calculate and return the mode from a given one dimensional array:
function getMode(array) {
    if(array.length == 0)
        return null;
    var modeMap = {};
    var maxEl = array[0], maxCount = 1;
    for(var i = 0; i < array.length; i++) {
        var el = array[i];
        if(modeMap[el] == null)
            modeMap[el] = 1;
        else
            modeMap[el]++;
        if(modeMap[el] > maxCount) {
            maxEl = el;
            maxCount = modeMap[el];
        }
    }
    if(maxCount == 1) {
      return array[0];
    }
    return maxEl;
}
Once again back inside knn():
let result = {
  "result": getMode(votes).
  "k-nearest": sorted,
}

return results;
We're returning an object containing the k-nearest points as well as the classification which will help us out momentarily when we go to add some additional visual effects to our graph.
However, we can go ahead and test that our algorithm works by running a test:
function setup() {
  ...
  console.log(knn(dataset, [10, 10], 3))
  //--> {result: "blue", k-nearest: Array(3)}
}
Krazy. Let's make it look cool so our mom's can appreciate it too! Define another a helper method for draw:
function showKNN(nearest) {
  for(let p in nearest) {
    stroke(nearest[p][1]);
    strokeWeight(3);
    let x = nearest[p][2][0];
    let y = nearest[p][2][1];
    line((mouseX - width/2), (mouseY- height/2), x*scale, y*scale);
    showPoint(np);
  }
}