Reasonable Judging
- Published on
- ∘ 29 min read ∘ ––– views
Previous Article
Next Article
Preface
I want to preface this post by saying that I have the utmost respect for Anish Athalye, the creator of Gavel, for doing hacker praxis and creating a practical tool which attempts to solve an issue he and his team experienced when coordinating judges for hackathon project submissions. Gavel is a super neat tool which uses some sophisticated graph theory to attempt to produce the fairest ranking of projects.
But... organizers should not use Gavel. In this post I want to provide a comparison between Gavel and another, nearly-as-equitable solution to the challenge of judging projects which, in my humble opinion, is vastly more accessible, extensible, and transparent.
Gavel Overview
Before critiquing Gavel, I first want to recapitulate how it works with some commentary, because it is really cool and I think Anish raises a lot of valid points about achieving fair outcomes. I encourage anyone who is interested to read his breakdown of how it works, but I'll also repeat a majority of the content here for ease of comparison (all the credit for the proofs/model obviously go to him and his team).
The first motivation Anish raises which I think everyone ought to be able to agree upon is that quantitative ranking systems are dog water. Ordinal rankings are far superior. They eliminate at least one layer of inter-judge bias by localizing the importance of absolute scores to a single judge.
For example, if we have two judges and with different backgrounds (technical, design, business, etc.), they'll likely evaluate projects differently. might be a faculty moderator who is impressed by all projects he evaluates, scoring them all in the range on his personal judging rubric for what he perceives to be a tremendous demonstration of the creativity and ambition.
, on the other hand, teaches a graduate course on Operating Systems and is rather unimpressed by the technical novelty of the projects she gets assigned, and scores most of her projects as she would grade an exam: flunking about a third of her assigned projects, and not giving a single project a score higher than a .
If we were to take these scores at face value, and determine the winners of our hackathon based off the potentially high-variance values, then we would clearly be disadvantaging the teams scored by the harsher of the two judges.
We could take such efforts as normalizing the scores from each judge (such that all their scores have a mean of 0 and standard deviation of 1, regardless of how punitively or generously judges scored their projects out of 50 or whatever arbitrary maximum score your rubric allows for), and also calibrating them according to our desired expectations as the organizers who have a pulse on the the target audience for our event:
But we can go even further to strive for statistical rigor in terms of the fairness of our judges' outcome. As Anish points out, normalization in this manner is ineffective unless judges view a majority of projects. This is covered in more depth later on in the explanation of the graph construction which underlies Gavel, but a decent high level model of understanding would be that unless the judges scores enough projects overlapping with the normalized scores of other judges as well, the result will just be a disconnected graph of normalized scores which have no relation to one another. (The proposed alternative covered in the second half of this post resolves this issue by dispatching cohorts of judges with explicit overlap of project coverage).
We could also just do away with these absolute scores entirely, and instead opt for a means of scoring which produces a transitive set of ordered preferences from our judges via Condorcet Methods.
Condorcet Methods
Condorcet methods attempt to find a pairwise champion given a set of options. That is, the candidate who wins the majority vote in every head-to-head election against each other opponent. There is not a guarantee of finding a Condorcet winner with multiple voters, though individual preferences are guaranteed to be transitive since voters are forced to order their preferences. E.g. Judge 1 might have the following preferences over a set of options presented to him: .
Resolving the paradoxes that might arise in the absence of a Condorcet winner (i.e. an election between rock, paper, and scissors determined by ) is possible with other extensions of social choice theory in order to mitigate the influence of bias and strategic voting.

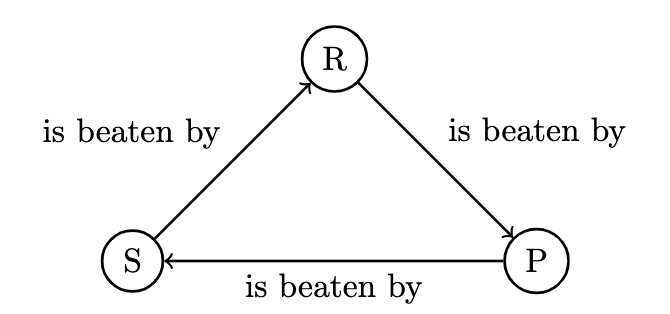
(There are numerous methods for tie-breaking and revealing voter preferences of ordering detailed in the linked articles.) Gavel's approach is to minimize the amount of disagreement between electors.
An election will have a Condorcet winner if and only if one candidate is preferred over all others after a pairwise comparison between each option. A Condorcet method finds the corresponding winner if one exists among candidates using pairwise comparisons. Counts are conducted by pitting every option or candidate against every other. The result of a sequence of these elections can be represented as a matrix or a directed graph:
Suppose we have judges with preferences and with preferences , their matrix representations would be:
where row entries represent victories of the incumbent over the columnal opponent. Therefore represents the number of times the incumbent was favored over an opponent by the Judge.
Via matrix addition, we can combine Judges' scores to get the following measure of cumulative pairwise preferences:
Here, option is the Condorcet winner since it beat every other candidate the most times.
As a directed graph, these preferences and outcomes resemble the following, where a directed edge from to indicates that was favored over :
(refer to the Rock, Paper, Scissors election above for a more intuitive illustration).

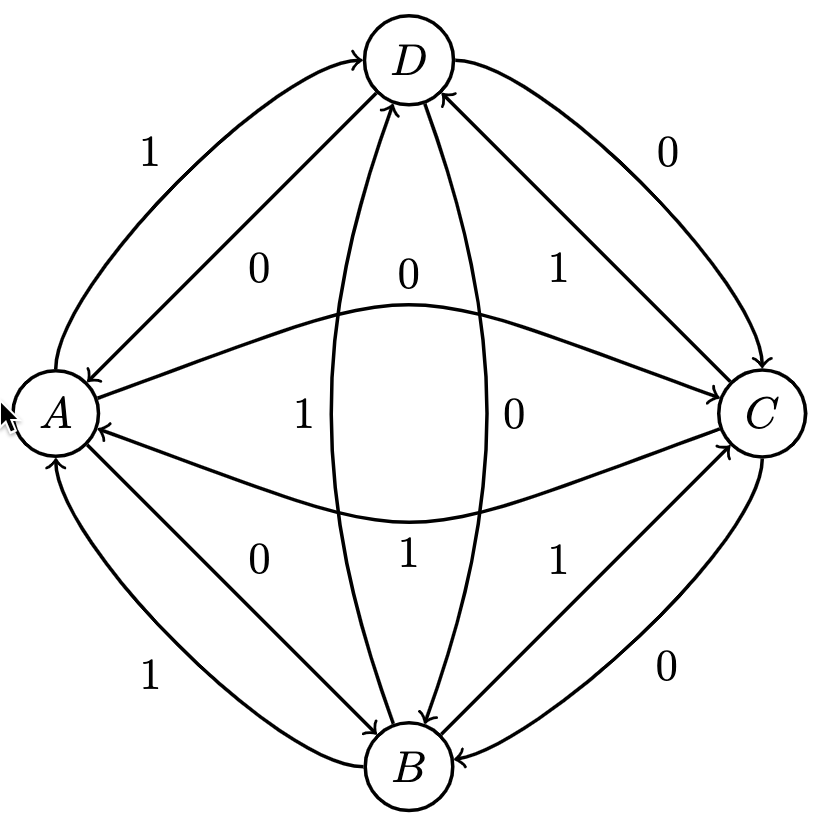
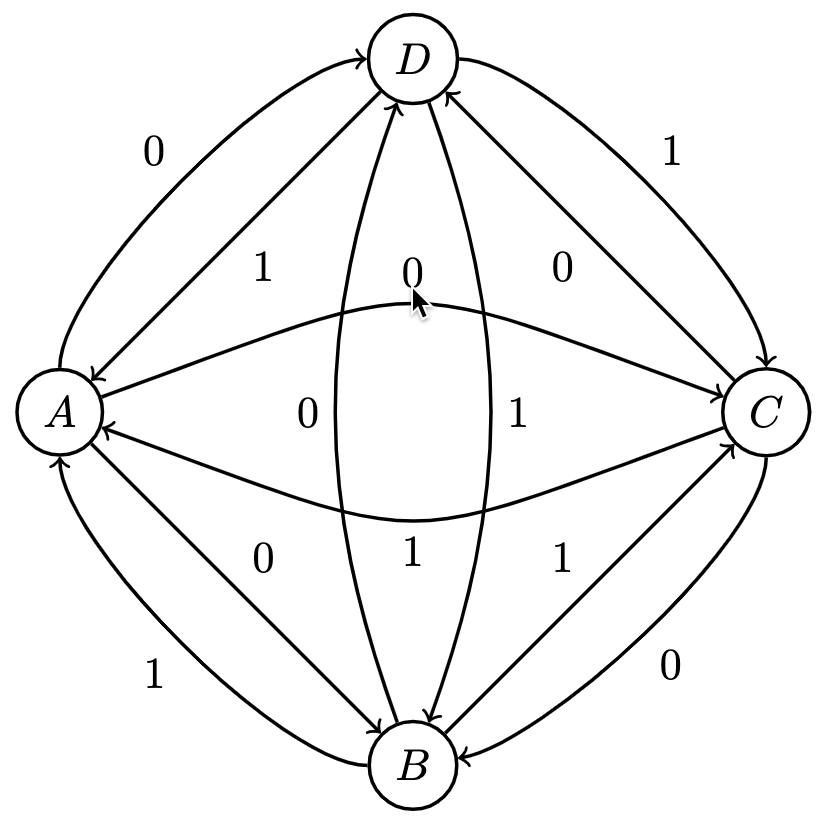
Measuring the in-degrees of each node yields the Condorcet winner, but as mentioned, a winner is not guaranteed.
Back to Gavel
Anish notes that pairwise comparisons amongst several projects with limited judges is still feasible per Luce's Choice Axiom which states that the probability of selecting one item over another from a pool of many is not affected by the presence or absence of other items. Selection has independence from irrelevant alternatives, meaning that we can select an arbitrary set of options to serve to a judge without impacting the fairness of the overall cumulative sum of victories (assuming that each item is viewed equally many times). Formally:
(The probability of selecting from a pool of items is proportionate to the weight of over the sum of all weights).
He goes on to formalize the means of comparisons stating that the result of a sequence of pairwise comparisons is a multi-set of tuples:
yielding a directed graph on nodes with edge having .
From this formal representation, the algorithm proceeds. While a topological sort produces an ordering that no judges disagree with, one such ordering might not exist since the resulting graph could be cyclic. To ameliorate this possibility, Gavel introduces a cost function to optimize.
Given with edges having weight , a permutation of nodes can be defined as , with backward edges defined as a function of the permutation:
The cost function to be optimized then is:
With the optimal ranking given by:
Informally, this optimization finds the ranking that the fewest judges disagree with (regardless of whether or not a cycle exists in the graph – so it's just about as close to a "strict" topological sort as possible). This is also an NP-hard problem (which in and of itself makes reasoning about it less accessible than, say, a spreadsheet).
Anish goes on to engage in a brief psychological lit review in order to justify some useful assumptions which help simplify the model.
First, the model assumes that all judges' rankings or comparative orderings can be expressed as Gaussian random variables. Judges then sample from the corresponding quality distribution of the two options presented to them and select the option with the higher sampled quality.
An option's true quality is the mean of the corresponding distribution. Given the data collected from the pairwise comparisons, if Gavel can compute the means of the Gaussians, then it has relative scores for every option from which global rankings can be computed.
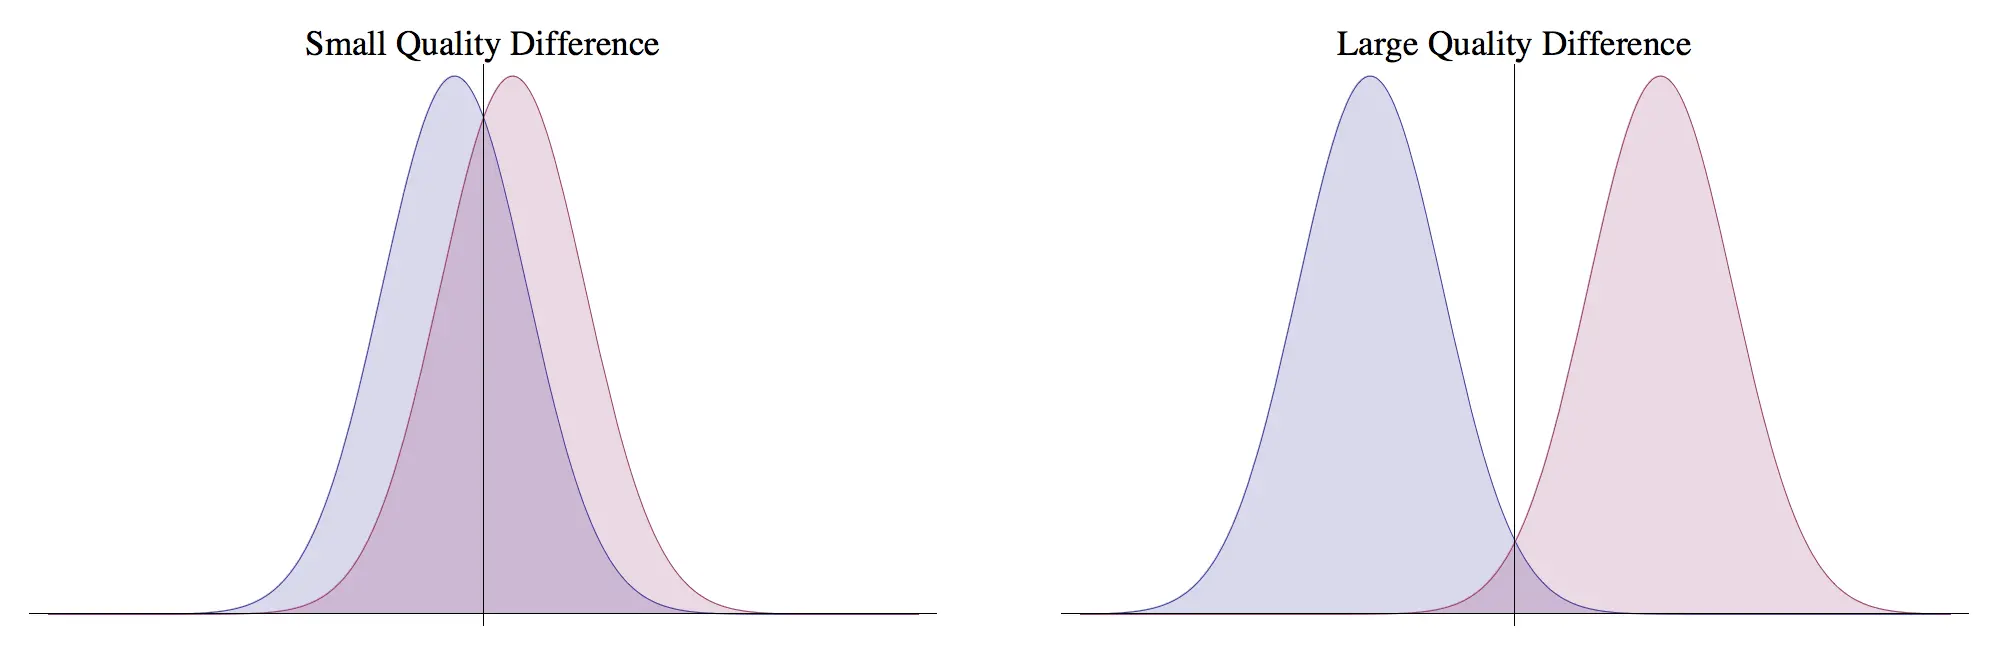
For example, consider two options whose values are sampled from a normal distribution:
with corresponding Probability Distribution Functions:
where is the standard normal probability distribution function:
With this information, we can compute the probability that a judge will select option over :
Assuming zero correlation between variables in the model:
This composition of random variables allows us to compute :
where is the standard Cumulative Distribution Function. Based on prior assumptions, the model can be further simplified by setting such that without loss of generality.
Under the assumption that there exists a true mean for each option expressed as a random variable, a Maximum Likelihood Estimator can be used to determine the most likely parameters for the model.
Given a single pair of options , the number of times each option is chosen is represented by respectively.
By properties of logarithms we can simplify:
Anish uses the matrix representation of the Condorcet results to define the global maximum log-likelihood of the parameters:
Then, referencing some further optimization techniques that I won't pretend to fully understand, the solution is given by the following convex optimization problem:
In order to achieve a sound global ranking, we need to collect a sufficient amount of comparisons to construct a connected graph (lest we suffer the same pitfalls of relying on localized normalization of absolute scores from our judges as mentioned earlier). A good way to guarantee robust data collection (which holds for the alternative model to be proposed shortly as well) is to have the judges rank a sequence of options. Gavel deviates from the alternative by rigidly sticking to pairwise comparisons and having the winner of a comparison between be compared to , carrying the winning option until it's defeated, and then using the new winner as the incumbent resulting in data points for elections adjudicated by a given judge.
Phew, hopefully that wasn't too dense. Let's now consider what I contend is a more accessible, extensible, and transparent approach which produces comparable outcomes.
Stack Judging
Stack judging relies on some of the same core principles of the Condorcet optimization techniques employed above. The Big Idea™️ is that, instead of using arguably slow pairwise comparisons, we instead assign judges batches of projects to evaluate and rank using a Borda Count.
For example, if a judge is assigned 15 projects to evaluate, they would be divided into a set amount of batches (say 3 batches of 5 teams apiece) as well as votes with weights to assign to each project, where the best project in the batch would be awarded 5 points, the second best 4 points and so on. (For larger batches, Borda counts are still correct if voters are allotted fewer weighted votes than candidates. E.g., the same set of discrete votes could be discretely distributed across more than 5 projects, with the "losing" option(s) receiving 0 points).
Judging Allocations
As a brief aside, the following formulae (appropriated from the MLH Hackathon Organizer Guide) can help determine how to time box your judging phase and allocate your judges.
- : the number of judges at your disposal
- : the number of submissions to your event
- : the amount of judges per cohort
- : the number of cohorts
- : the amount of teams to be viewed by each cohort
Additional parameters such as allowable demo duration and total time allotted for judging to take place may be set in stone by the powers that be, or can be derived from the above values.
The greatest strengths of Stack Judging is that it can be orchestrated via a collaborative spreadsheet which is a familiar technology for most of the folks who you'll likely be leveraging for the scoring process, and it's highly configurable.
This folder contains some template/example materials which I'll be referencing for the remainder of this explanation. I encourage any readers to augment them to their liking!
Master Spreadsheet
The master spreadsheet is where the meat and potatoes of the judging takes place. It contains a couple tabs to organize the information:
Internal-import
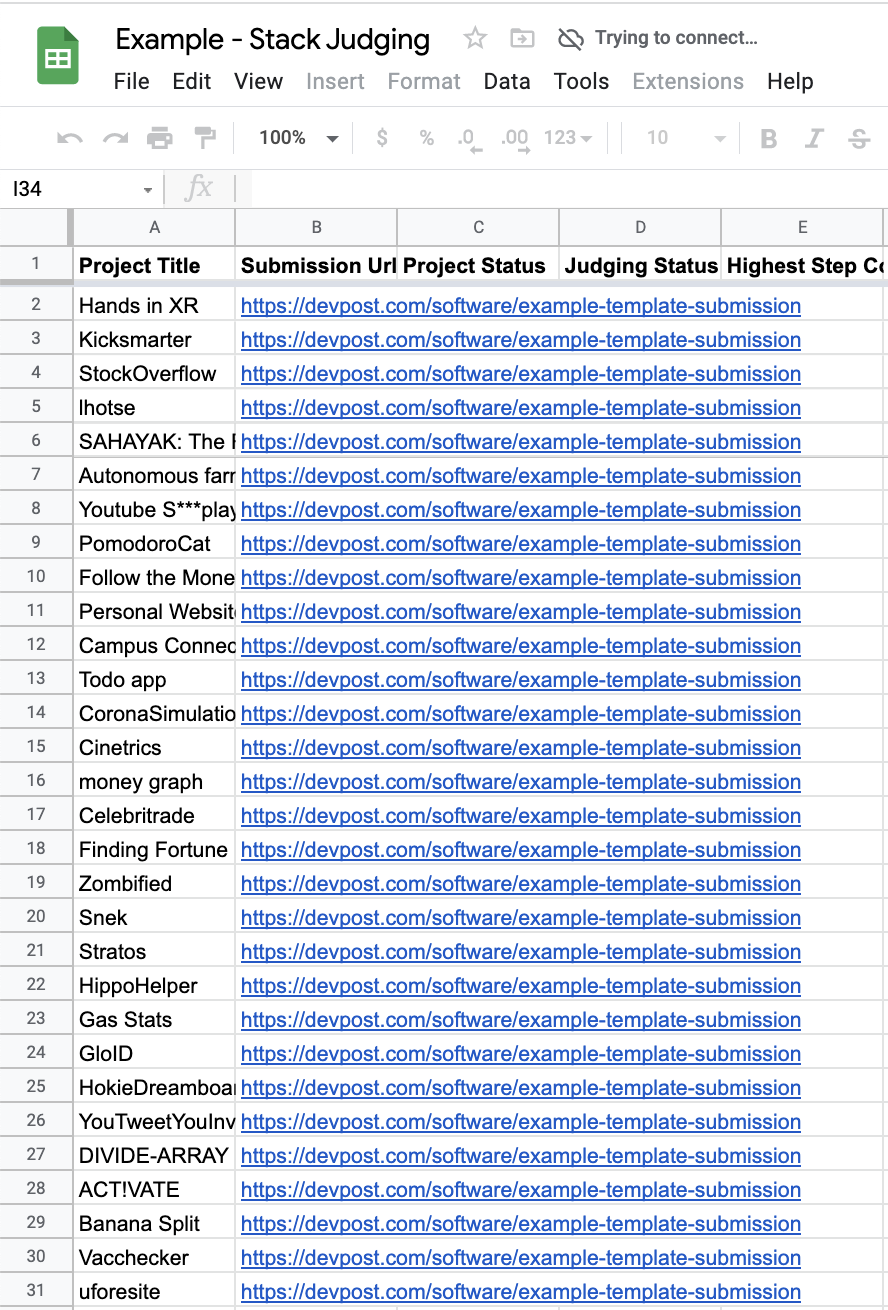
This is where you'll import your submission data. The example provided expects Devpost data because that's the de facto standard. If I'm going to die on any hills, the first is that you should use Stack Ranking, and the second is that you should use Devpost.
From the hackathon management > metrics tab within Devpost, export your submission data and import > replace the current sheet with your submission data. All we're really concerned about is the Project Title and Submission Url columns, so if you're using something other than Devpost, you can substitute the appropriate fields here.
The rest of the columns are still useful if you need to go searching for a specific project by keyword or whatever. For the sake of this example, all of the submission URLs are the same, but obviously your data would reflect your event's actual submissions.

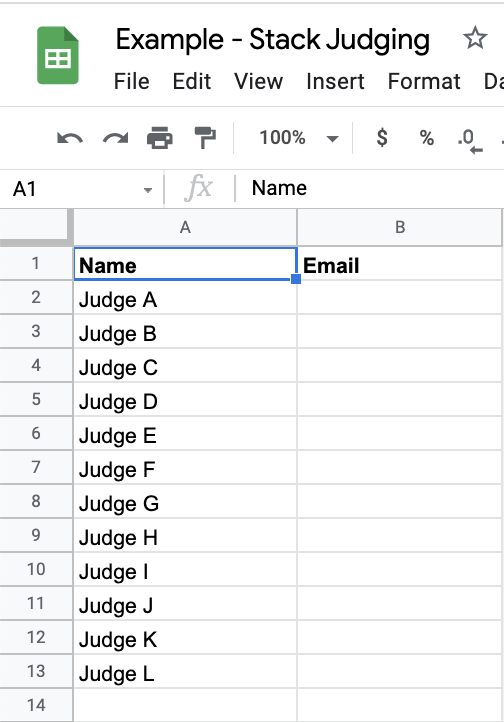
Confirmed Judges
This is where you'll enumerate all your judges. Big thanks to Judges A through L for volunteering for my fictitious event this evening.

Judges Progress
This is a nice little bell & whistle I've added on top of MLH's template which requires a bit of manual configuration, but allows you to monitor your judges' progress without having to invade their personal rubric sheet.
To configure this tab, an organizer has to import each judge's personal rubric into the sheet with the following queries in the relevant columns:
=COUNTIF(IMPORTRANGE("<SHEET_URL>", "H2:H"), ">0")
=COUNTIF(IMPORTRANGE("<SHEET_URL>", "A2:A"), ">=0")
You should be prompted to allow access to the sheet. If you don't see a prompt, try removing the enclosing =COUNTIF() command momentarily so that the =IMPORTRANGE command is the outermost instruction, then re-adding the COUNTIF command once you've accepted the dialogue box that should pop up to allow sharing access between the Master sheet and that individual judge's rubric sheet..

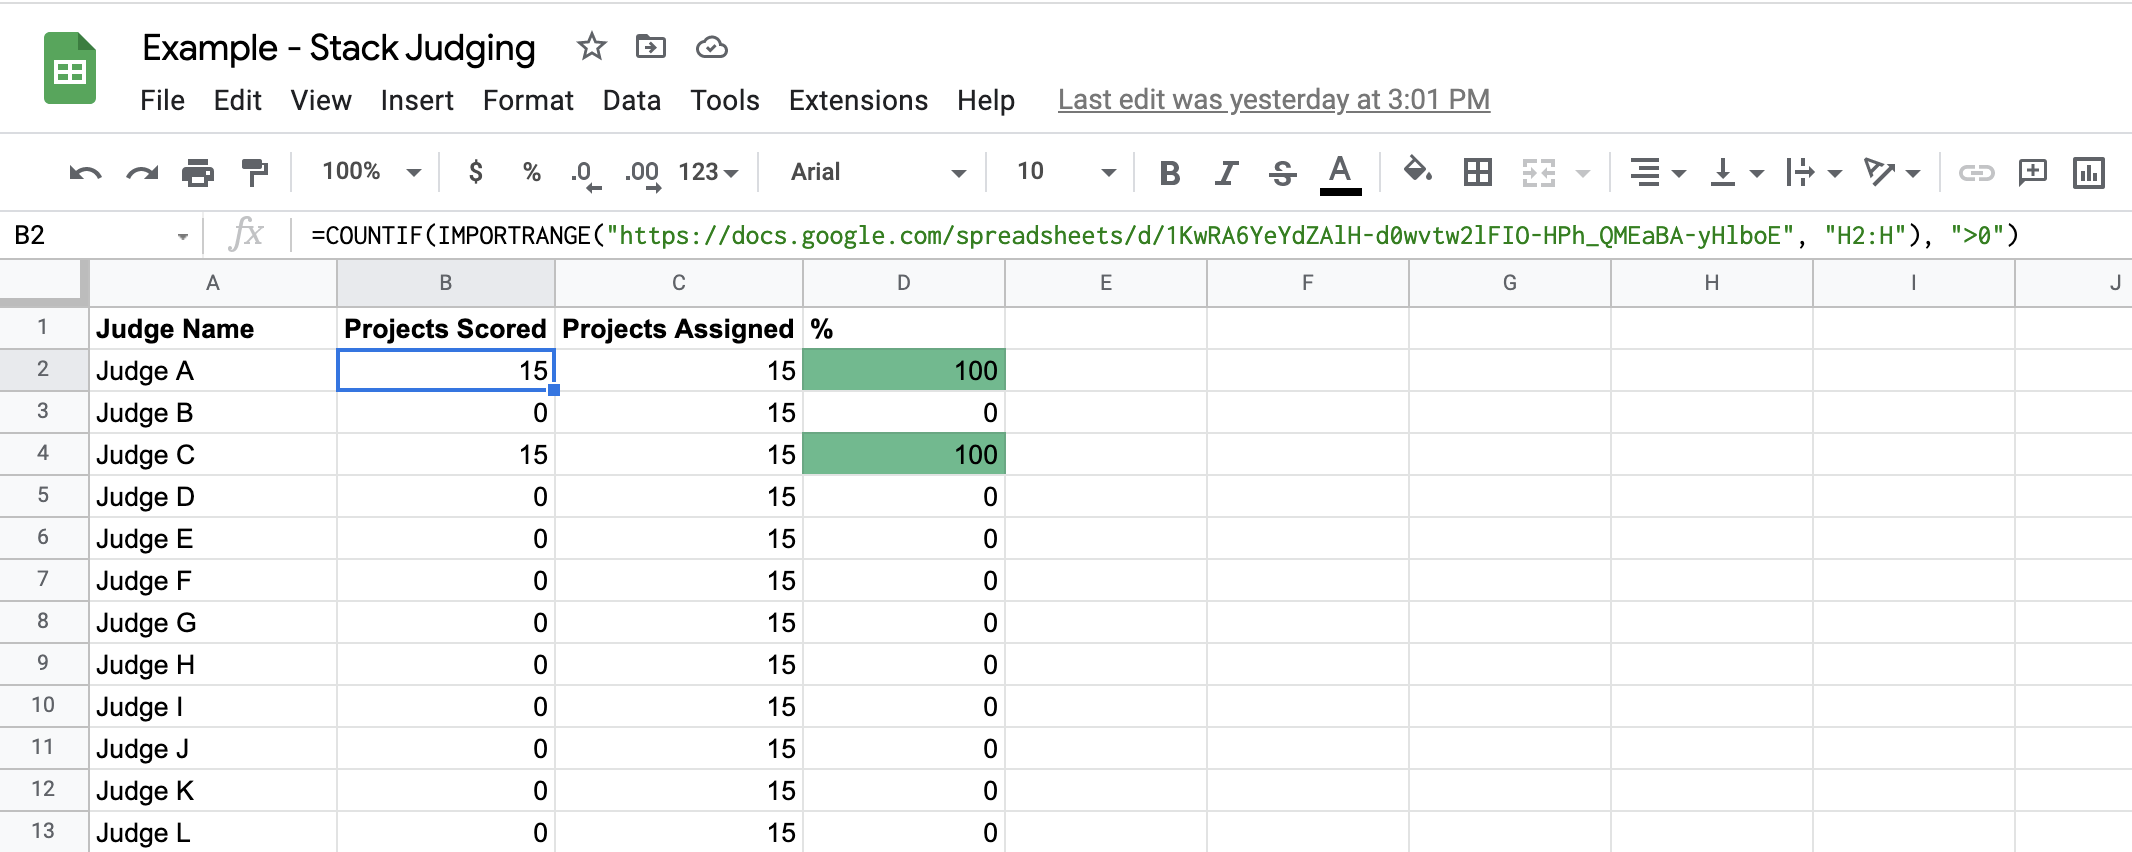
This gives us a useful completion metric for each judge by counting how many rows in their personal rubric sheet have non-zero scores. Here we can see that Judges A and C have filled out some scores in their individual rubrics (although damning) for all their assignments as reflected by the completion bar, thanks Judges A and C!
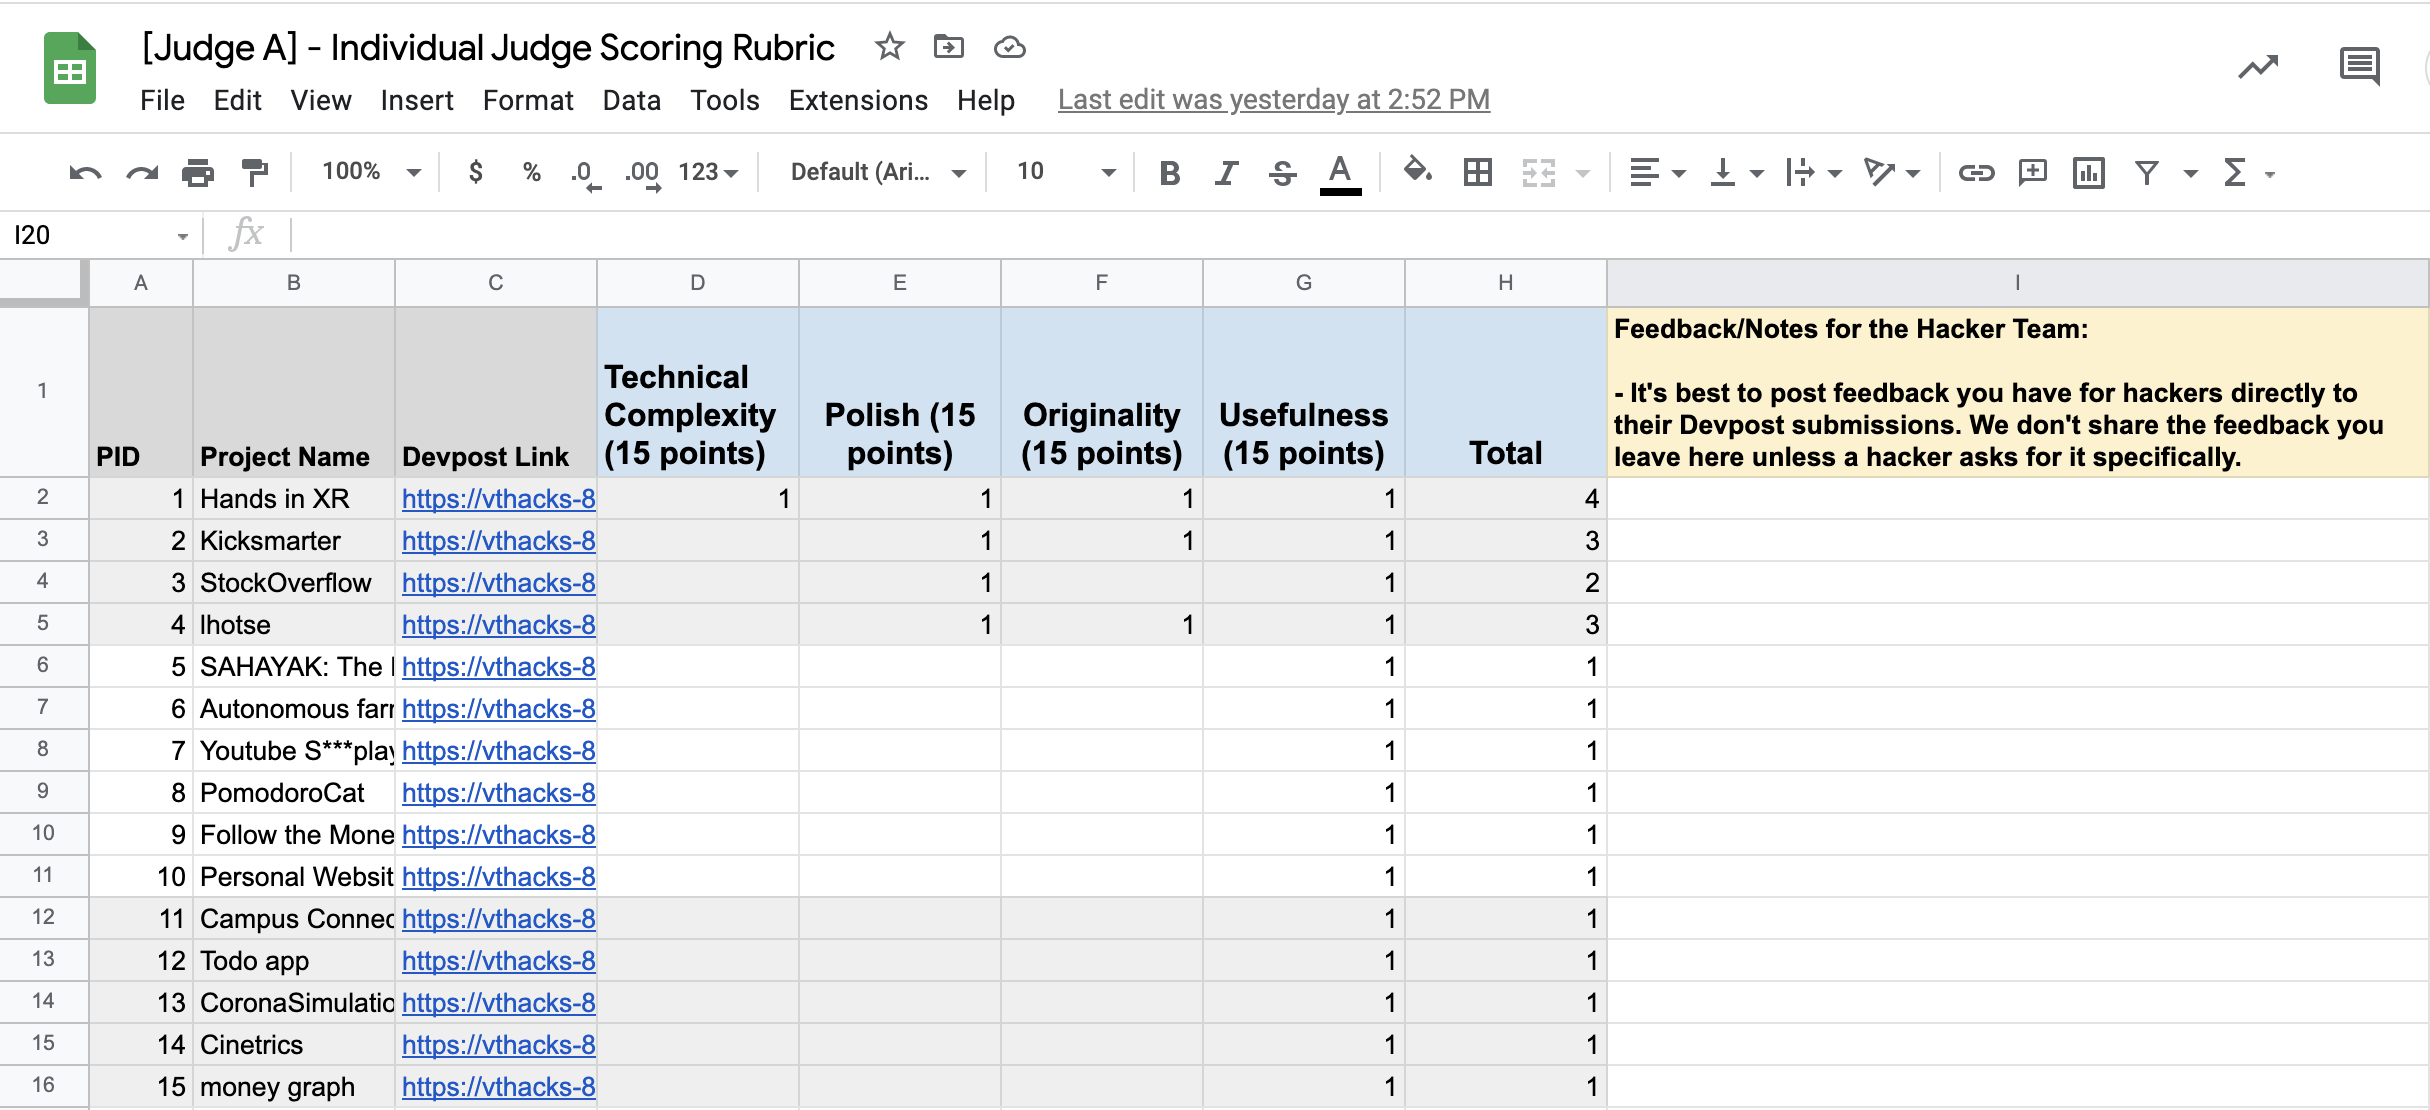
Individual Rubrics
On the matter of individual rubrics you'll also find several other spreadsheets in the shared folder; one for each judge. This is a place for judges to cast their absolute project scores.
Once judges receive project range assignments, they ought to copy columns A, B, and C from the Stack Judging tab into the same columns within their personal rubric (or, you can do this for them if you have the bandwidth).
The axes of criteria are arbitrary, but it's recommended that you calibrate your judges with some examples of what a 10/10 in category means versus, say, a 2/10. Similarly to Gavel, we don't actually care at all what the absolute scores judges ascribe to their assigned projects are– only the relative orderings of projects in their batches.

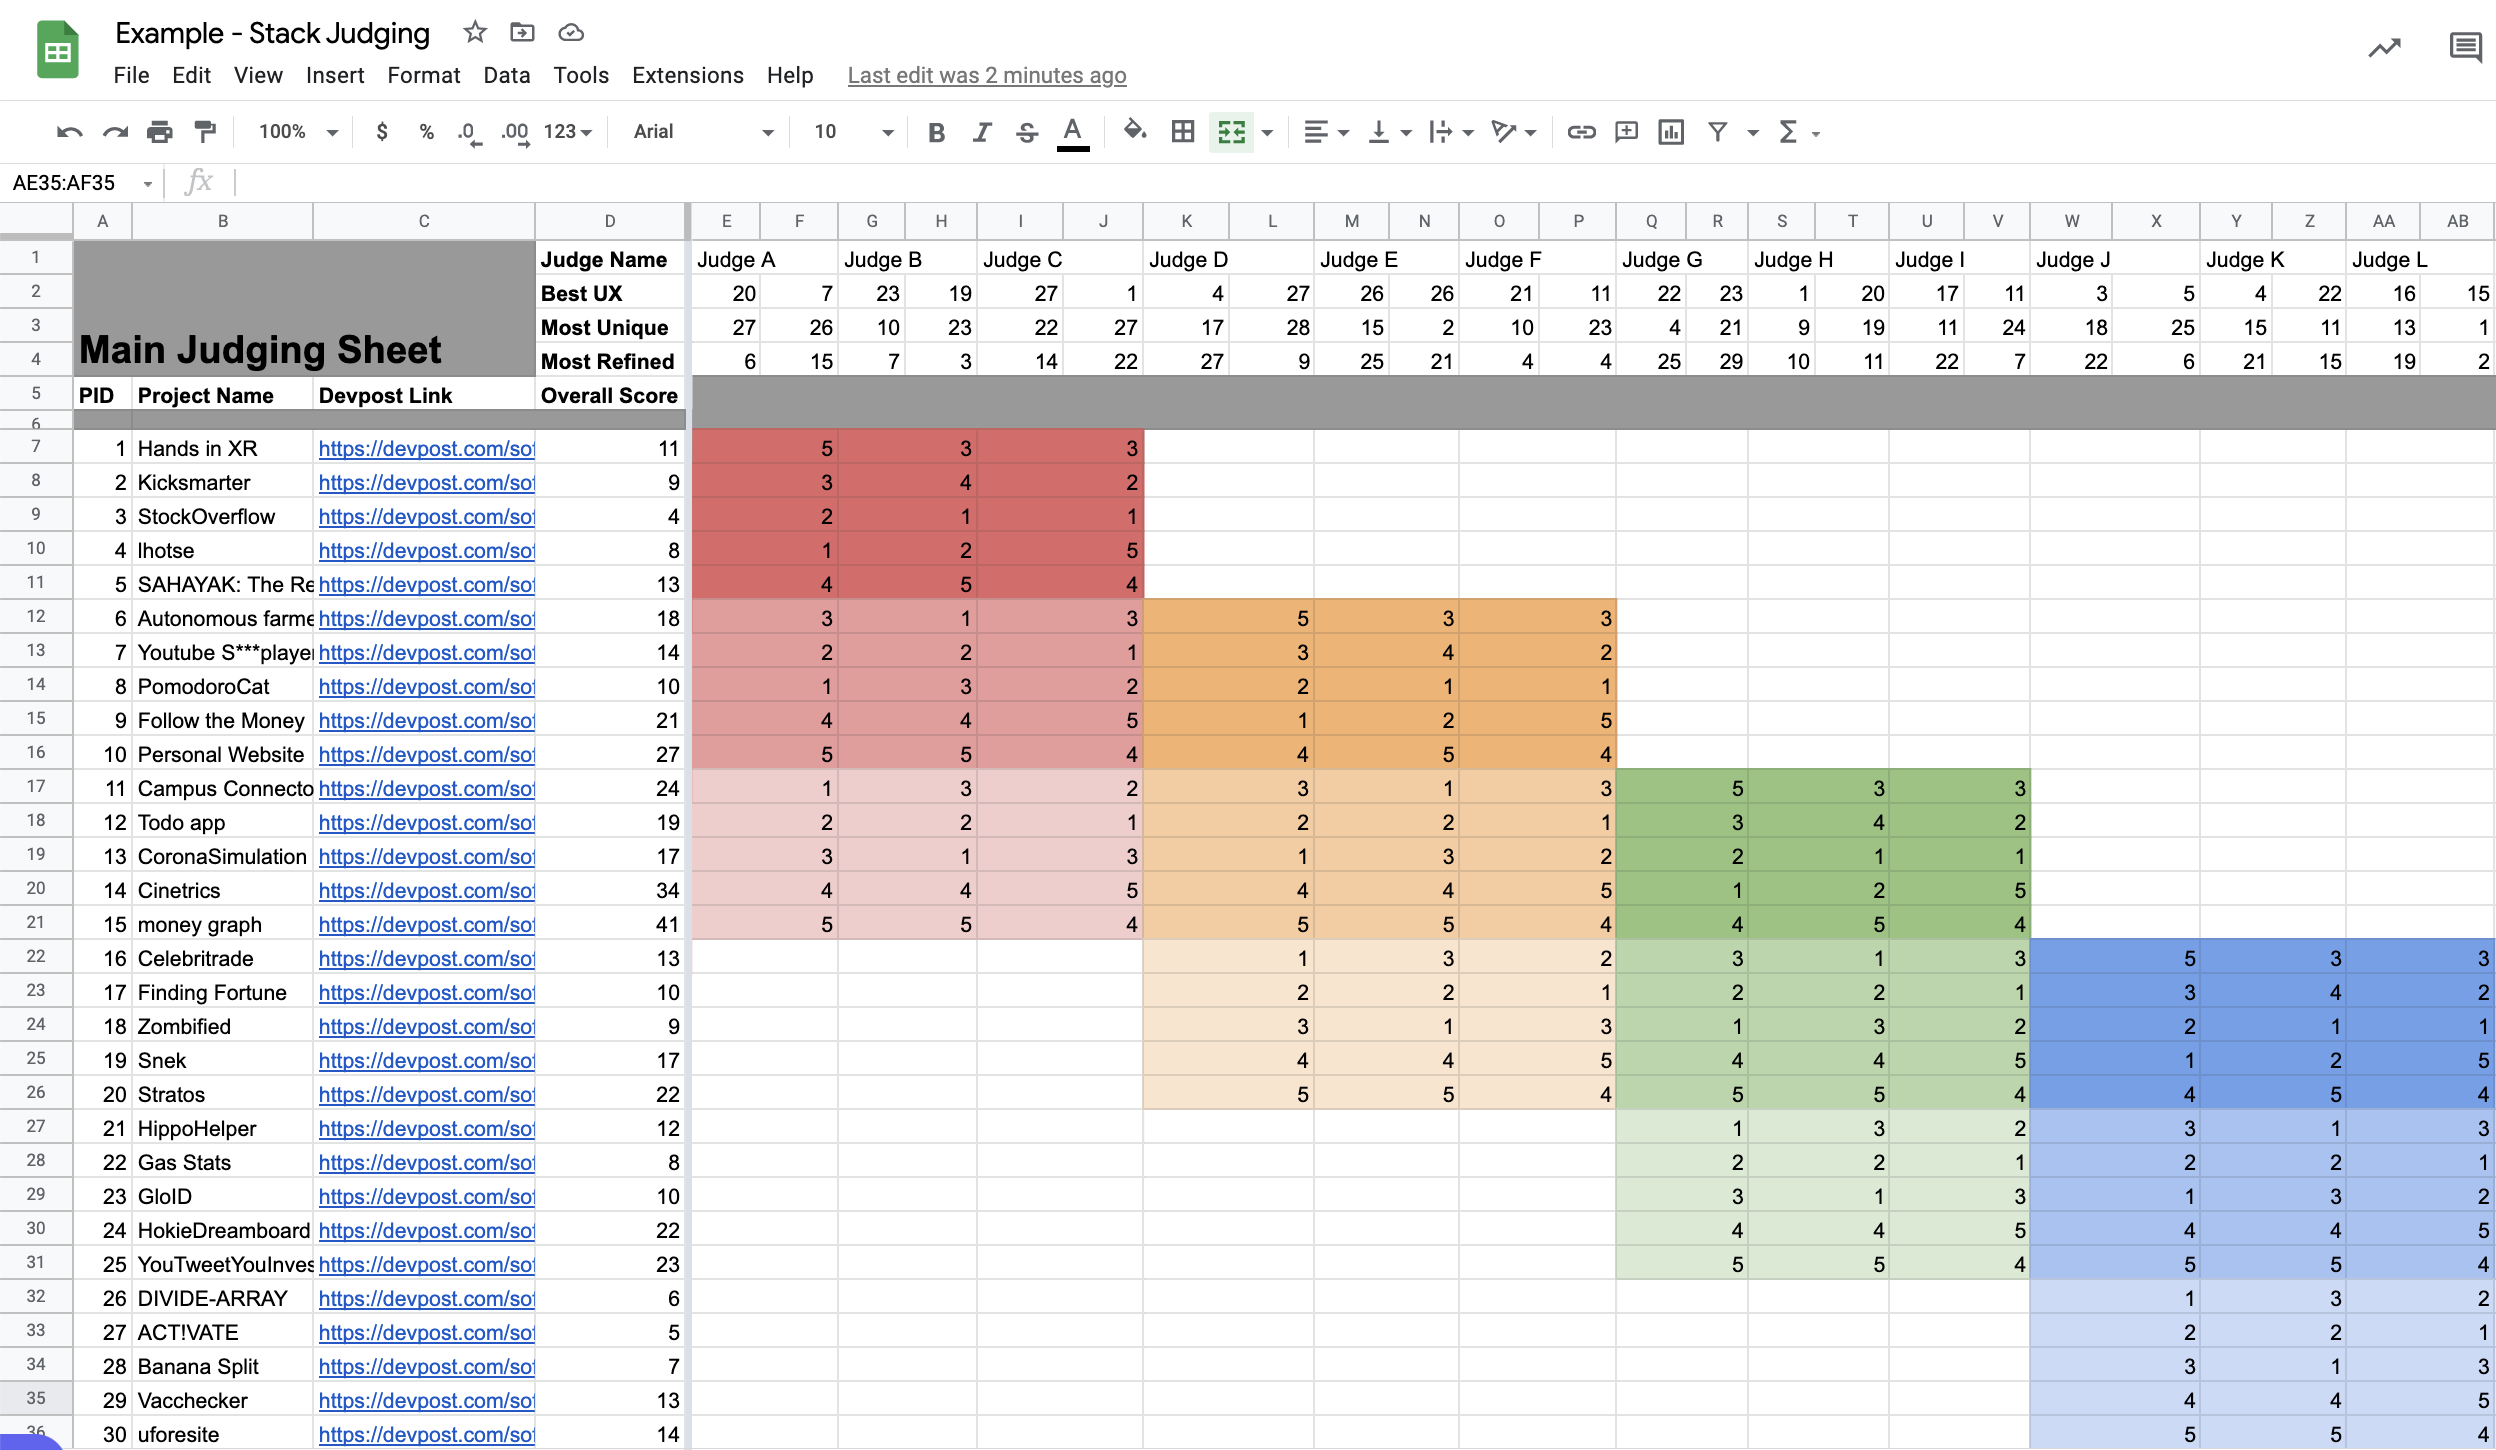
Stack Judging
This is where the business happens! Once a judge has evaluated a batch of projects (color coded for their convenience), all they have to do is assign their Borda Count scores within this tab. The cumulative scores are horizontally tallied in column D, and winners are automatically displayed in the aptly named Winners tab.
It's recommended that this whole process is demonstrated to judges in advance of the judging phase and that a few organizers make themselves available to the judges throughout the process in order to help troubleshoot any issues that may arise. Additionally, an accompanying slide deck or document which details how judging ought to take place should also be provided to judges.
The breakable bits of this tab can be further obfuscated as you see fit, but centralizing the data helps minimize the amount of time spent juggling browser windows.
Note that the batch assignments are staggered to achieve the same effect as the sequential judging assignment described in Gavel's data collection process. Here, the goal is to construct a connected graph as well, but we don't concern ourselves with actually thinking about the graph, just making sure that we have overlap. I'm also aware that teams 1-10, and 21-30 are disadvantaged in this illustration as they are viewed by fewer cohorts of judges than the middle range. In practice, you would "wrap around" the range of team submissions to guarantee equal amounts of viewing for each team.
With respect to the extensibility of this spreadsheet, see also rows 2-4. For unique categories like those included in the example, you might also provide additional criteria for judges to keep in mind when viewing project demos. In this example, the categorical eligibility spans all the projects assigned to a judge, and they're asked to pick some teams to nominate for those categories. The mode of each of those rows is calculated in the Winners tab to automatically select a winner.
Once a judge has viewed all the projects in a batch assigned to them and recorded the scores in their individual scoring rubric, they assign values (with option zero-padding as necessary) to the corresponding cell in this tab. Here I've entered some arbitrary data for all the fields so that our winners tab will be populated. I would caution against encouraging judges to enter arbitrary data for their assignments; do as I say, not as I do.

Winners
This tab is pretty self-explanatory insofar as it imports the Overall Score column from the previous Stack Judging tab, and displays the top 10 projects. The Project ID (PID) of the unique categorical projects are displayed under the internal prizes section, and to further save organizers the hassle of hunting down sponsors for their winners, another section is provided to accommodate the external prize categories which may be available at your event.

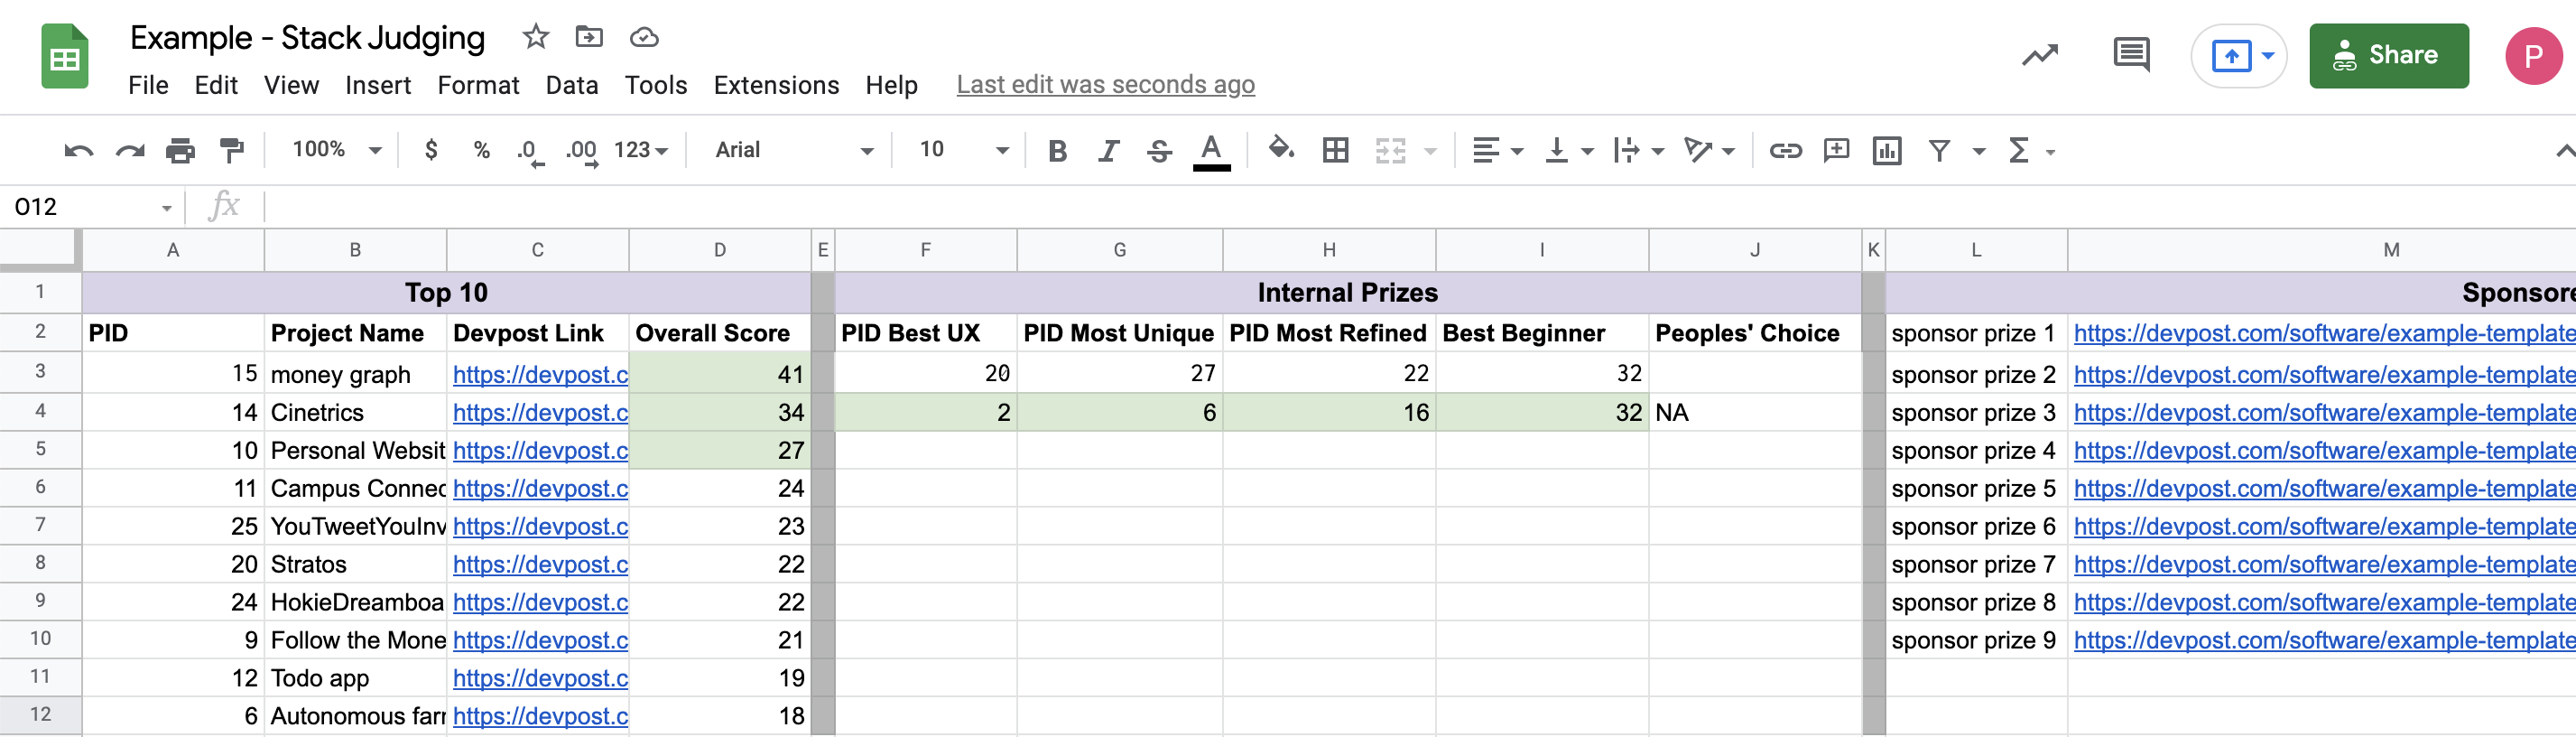
Best Beginner
I chose to leave this tab in as a reminder that, as the organizers of your event, you should feel empowered to make executive decisions in order to keep the event on schedule. If you wish to spread the wealth of prizes across submissions so that the sense of accomplishment of your participants can be shared by more folks, then you should do so!
This is also why the Winners tab displays the top 10 overall projects rather than just 3. If one project sweeps all the categories, and you'd rather have 7 winning teams rather than 1 mega project which wins all the prizes, then you can quickly select the runner up in any given category to find the next eligible team. Yes, this whole post is about equitable judging outcomes, but at the end of the day, I am not beholden to math, and neither are you. We're here to have fun and deliver fun, after all.
As the wikipedia article on Borda Counts methods mentions:
There are also alternative ways of handling ties.
I recommend that you exercise your own authority to break ties.
Now, the obvious question is whether this slightly-janky spreadsheet is as rigorous as Gavel? Luckily for us, Borda Voting methods and other variations of positional voting systems share similar properties of Condorcet methods.
Though sacrificing the precision of strict pairwise comparison, the batch-system described above still produces an ordering of projects, and the by dispatching judges with explicit overlap in assignments, we can guarantee that the output is a connected graph. Despite the absence of a convex optimization problem, this method also produces an ordering of options which minimizes disagreement between judges
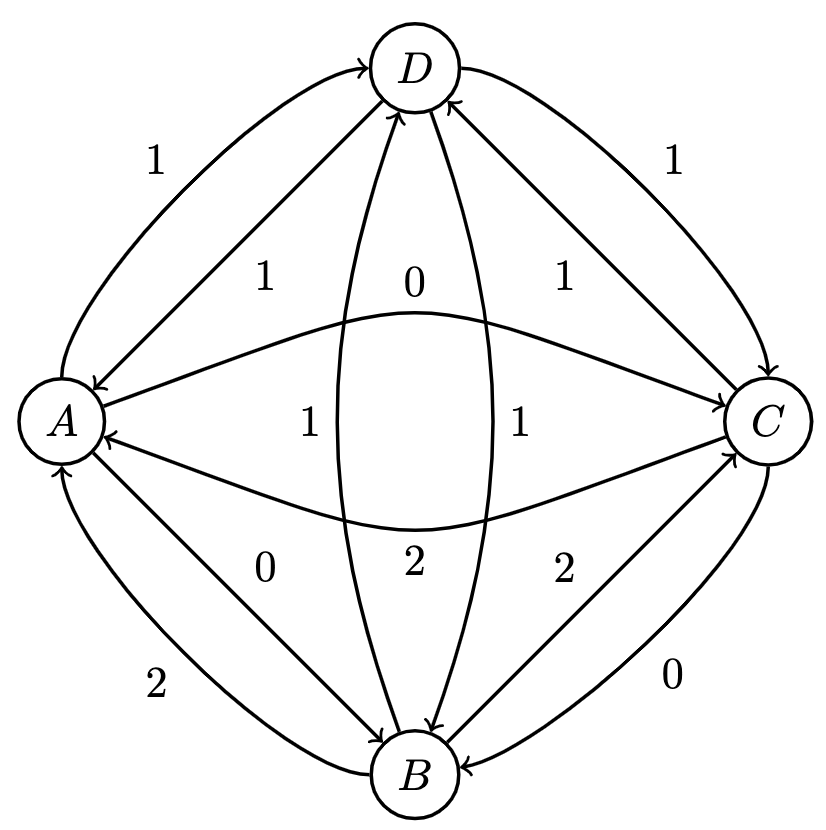
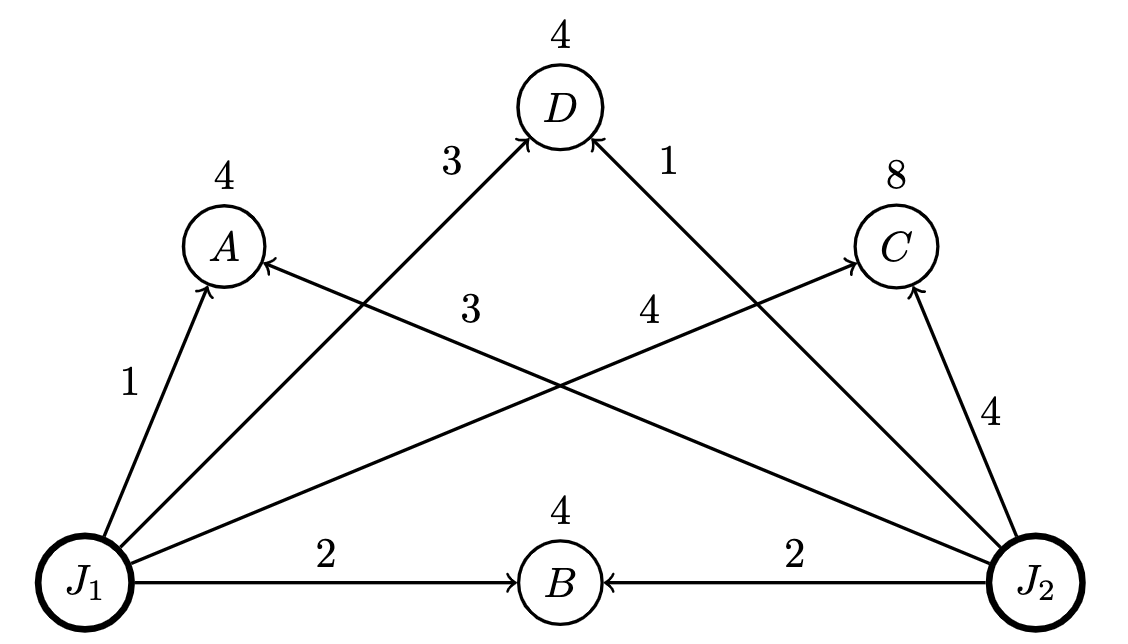
For example, if we have the a cohort of judges with the following scores for their assigned batch:
| Project | ||
|---|---|---|
| A | 1 | 3 |
| B | 2 | 2 |
| C | 4 | 4 |
| D | 3 | 1 |
Then we get the following weighted digraph from which we can also achieve a global ranking:

Conclusion / Comparison
Gavel is theoretically sound, and again, it's quite cool. But it does have its drawbacks. Stack ranking as presented above is not without its own drawbacks, but I maintain that it's more accessible, more easily extensible, and more intuitive or transparent.
| Gavel | Stack | |
|---|---|---|
| Setup | Gavel's UI is pretty straightforward and automates much of the task of assignment for you | Stack judging requires slightly more legwork to configure, especially for the judges' progress tab and assignments, but it largely consists of copy/pasting |
| Accessibility / speed | This metric ultimately comes down to how well prepared your judges are rather than the platform you're using. However, unfamiliarity with Gavel might cause some delays. Additionally, judges are unable to revise their comparisons/take notes on projects within the application which might be useful if you have –for some God forsaken reason– engage in deliberation | Pretty much everyone who you might enlist for the task of judging will be familiar with spreadsheet software. Additionally, the individual judge's rubrics are fully customizable. The main downside is that you might have to juggle several browser windows in order to properly moderate judges |
| Extensibility | Though Gavel is open source, it still takes some technical know-how in order to tailor it to suit your needs if judging requirements exceed the out-of-the-box functionality | Spreadsheet-fu is arguably only slightly easier than python, but it's directly available in the spreadsheet (for better or worse, re: breakability) |
| Transparency | The underpinnings of Gavel are going to be a blackbox for pretty much everyone except the organizer who sets it up | All of the data is already in spreadsheets and plainly visible to anyone with access to the spreadsheet(s) |
| Correctness | With sufficient time and judges I think that Gavel likely produces more statistically sound global ranking | But simultaneously, I don't think that most events are sufficiently staffed/scheduled to achieve this optimum. Furthermore, stack ranking is good- and transparent enough to justify most outcomes |